IVM heap usage & game objects
-
@artch said in IVM heap usage & game objects:
result were showing heap usage of up to 80% with no code running.
Again, it seems normal. Garbage collection may start running approximately at this point.
I still think that running garbage collection every second tick even when my code is not running seems excessive, especially when it was running thousands of ticks without triggering at all before the change that increased the total heap available. It might be random and a coincidence, but to me it seems like it was introduced at that change, as shown in my previous posts.
-
@geir1983 is it possible that the change gave GC enough heap that it skips every other tick now, where previously it ran every tick? Wouldn't this have kept heap to a minimum every tick previously, while now it bounces around?
-
@Gankdalf I have no idea, it sounds plausible, but my graphs were atleast not showing this. I attempted to run gc() every tick to see if this worked like you suggested, but it destroys my bucket, the call costs 70-90 cpu. Is there a different version that is running in the background?
-
@geir1983 Does the automatic GC call count against your bucket if it is triggered by the Game object creation each tick (which is likely the cause of a lot of this issue in the first place)?
-
You may try to call
gc(true)to run scavenge only (minor collection cycle), it isn't full collection, but works very fast.
-
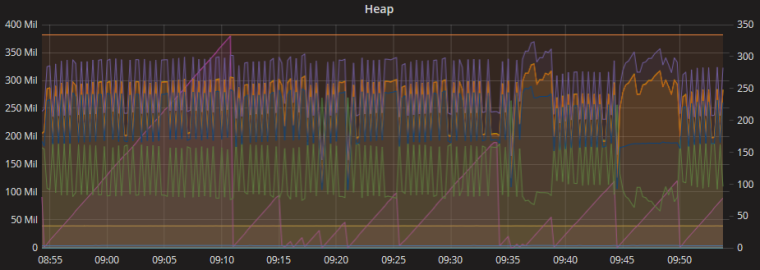
Calling gc(true) did cost a lot less, but it does not give me any noticeable effect (it was cleaning ~1mb for ~1 cpu). Calling gc() does clean my graphs (cleaning 10-50mb, for 60-90 cpu), but it cost so much that my bucket crashes pretty fast and the graphs was still not as smooth as it used to be. I could not let it run longer, because my bucket was emptied.
Is it possible that the game was calling some other gc function in the background before and that it is free when the game calls this as opposed to the player calling it?
09:15 - 09:35 calling gc(true), 09:35-09:38 calling gc(), 09:45-09-50 calling gc()
-
@geir1983 The game itself never calls gc explicitly, it is done automatically by V8.
-
Could it be that before the gc was hitting in a region of code outside of the userland CPU measurements and now it's hitting inside it? Not everything counts toward user CPU, so if GC previously reliably hit in game object creation (for example... I don't actually know if that's inside or outside the timing) and now with the extra size hits inside the user timed loop more often then you'd notice a big difference.

-
The scenario @Tigga described ^ is exactly what I see. Here's a graph of my CPU (top) and heap + Global Age (bottom) for the last week or so. You can see that my CPU usage drops steadily the longer my global has been alive. I believe this is because some small leak slowly changes the heap characteristics such that GC transitions from almost always happening during my user code (incurring massive CPU cost) to almost never happening during my code. I know it's a difficult problem, and I certainly don't have a solution, but I dream of not having to deal with the volatility of GC. I'm confident that the immortal
Gameobject changes will help immensely.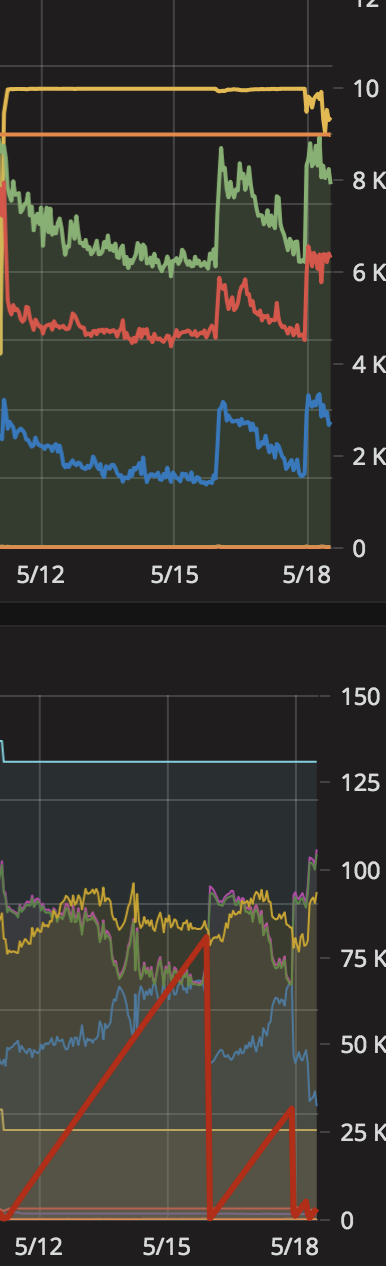
-
I found that if i disable my Observers scanning function my heap memory is no longer exceeded nearly so often. My observer scanning worked sort of like a radar, they would sweep the nearby rooms and enable vision in a room i could not currently see. Currently with the scanning active my heap was reset (memory exceeded) every ~25-100 ticks. With the scanning disabled i again can reach thousands of ticks on the same heap. ( It is still fluctuating a lot, but not going over the limit all the time).
Normally i have vision in about 230 rooms and when adding the Observer scanning, which means 30 more rooms will be added/removed each tick obviously had a huge impact. Without this scanning of rooms my heap is now much more stable. To me it seems like there is an issue when many rooms will be added/removed for only a tick at a time?
-
since ~21.6. heap/auto-gc problems (resulting into ~+30%CPU in average per tick for me) are back again on shard0. I already reduced my bases on shard0 in the past to prevent heap problems, but out of nowhere loosing every second tick a regular full tick execution is so cruel. It seems auto-gc is also firing when there is enough heap left. The auto-gc threshold seems to be on a much lower level now

-
@demawi said in IVM heap usage & game objects:
I have more problems with this: (don't know if it's also a heap problem?)
[00:06:38][shard0]Script execution timed out ungracefully
[00:06:43][shard0]Script execution timed out ungracefully
[00:06:48][shard0]Script execution timed out ungracefully
[00:06:53][shard0]Script execution timed out ungracefully
[00:06:58][shard0]Script execution timed out ungracefully
[00:07:03][shard0]Script execution timed out ungracefully
[00:07:07][shard0]Script execution timed out ungracefully
[00:07:12][shard0]Script execution timed out ungracefully
currently... each tick without getting to my code.. I already had such a phase a few days ago.where it lasted over 200 ticks..
This is exactly what im running into aswell. Ive already tried all kind of stuff to get it fixed in the past 2 weeks, nothing helps. When the Code is running for a while it starts to happen, and then seem to get more frequent until at some point every tick does give this error for up to 500 ticks in the worst case.
Reassigning Heap per shard like Cpu would only be fair, I do not want any Rooms on other shards.
-
Had no Issue for the last 2 days (most likely since the server was down on saturday), it just started again with the mail from 5:54
-
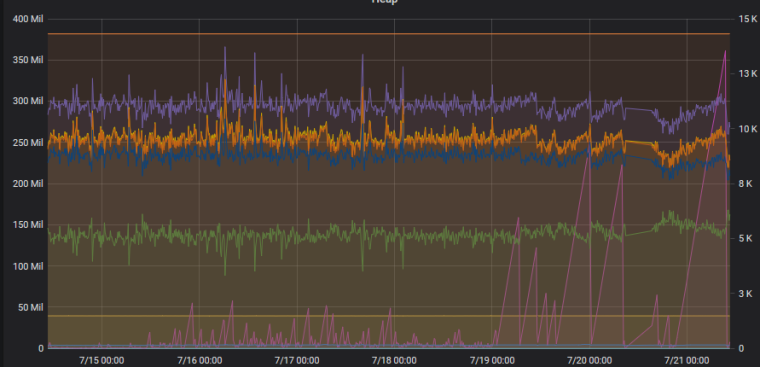
Update: After i started removing all left over structures in my remotes i am hardly getting any more "Isolate was disposed during execution due to memory limit". Before i removed all enemy structures in remotes my global lasted on average 50-100 ticks before the limit was reached. After i aggressively started clearing all abandoned rooms near me (ive cleared 70+ rooms now), the problem is as good as gone, my global can last for thousands+ of ticks again, mostly resetting when i upload code. This further strengthens the theory that it is the game objects that is a big problem when you have vision in many rooms, not player code. My heap graphs are still very noisy, but it is no longer reaching the limit randomly.
I started clearing the abandoned rooms the 7/19 and did no code changes relating to optimizing globals since then.
-
I really would like to put attention on this issue again. I was hoping the promised persistent game objects would completely change the heap behaviour/requirements. Now that the persistent game objects seem to take awhile the problems with heap persist.
I am at GCL34, everything on shard1, I have vision on ~230 rooms in which there are ~5100 structures, fielding a ~1000 creeps. My heap from tick to tick starts at 65% goes 90% and then back 65%. It seems to skip garbage collection when at 90% every so often resulting in hitting a memory limit reset. Sometimes it's 2 times per hour, sometimes it's 20~40 times per hour.
If I call
gc(true)every 3rd tick I loose a massive amount of CPU. At GCL32 I had a 3 step heap build up doing roughly a 55%, 70%, 85% cycle without missing collections, things ran massively better at that pattern. My CPU took a nose dive since.It seems to me the heap is just to small for V8 to do it's 'regular' garbage collection scheduling. I am still left wondering what on earth requires 250mb of heap space after garbage collection. That's more then 1 mb per room?
Could we possibly get more heap until the persistent game objects land?

-
@tun9an0 said in IVM heap usage & game objects:
I am still left wondering what on earth requires 250mb of heap space after garbage collection
Maybe the same that causes chromium processes to guzzle up all that RAM like there is no tomorrow? Since V8 is also what runs in those.
-
@orlet No, if your PC has plenty of free memory Chrome may liberally allocate large heaps. It doesn't mean anything in context of this issue where the IVM is starving for heap (aka no free space).
-
I gained another GCL and now call
gc(true)every tick. It ticks 64% and then 85~95%. I still get frequent resets on code running on top of the 85~90% (which I can't get rid of).Please some response to this would be nice...
-
Back up to bouncing off the memory limit here. ~230 rooms visible. ~5000 structures in Game.structures. ~850 creeps in Game.creeps. On top of this there will be plenty of enemy creeps and structures.
What's the ETA for persistent game objects?
-
Things had been running a bit better since the last heap increase but today, or just now, a shift happened in the heap which is murdering my CPU.
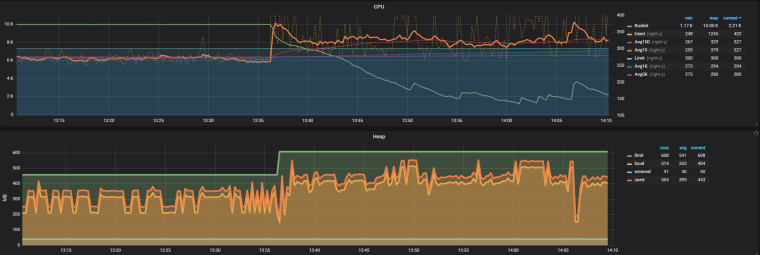
The downword peak in heap shortly after 14:05 is a code upload to reset IVM. Before this I dropped ~15 cpu worth of remotes, currently I am at ~30 cpu less remoting and only now it starts to somewhat recover.
If the server was reconfigured to improve things, please consider reverting...