IVM heap usage & game objects
-
Back up to bouncing off the memory limit here. ~230 rooms visible. ~5000 structures in Game.structures. ~850 creeps in Game.creeps. On top of this there will be plenty of enemy creeps and structures.
What's the ETA for persistent game objects?
-
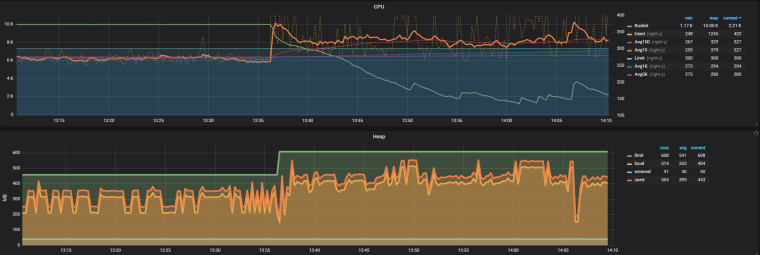
Things had been running a bit better since the last heap increase but today, or just now, a shift happened in the heap which is murdering my CPU.

The downword peak in heap shortly after 14:05 is a code upload to reset IVM. Before this I dropped ~15 cpu worth of remotes, currently I am at ~30 cpu less remoting and only now it starts to somewhat recover.
If the server was reconfigured to improve things, please consider reverting...
-
@tun9an0 The only change today was increasing heap limit by ~30%. Some side effects in your code probably reacting on the increased heap size?
-
@artch Only interaction I have with heap is doing gc(true) when the heap gets to 85% use to avoid memory limit resets. I have not made any changes to my workload before the above drop in bucket. Apart from the heap getting bigger the local use seems to have shifted with about 200mb also, I have no idea how I could influence that... Getting a 30% increase with the local use staying where it was would be very liberating

-
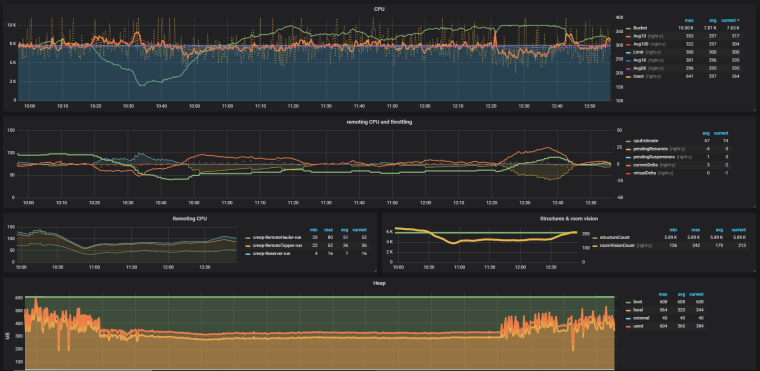
What I am currently running into is the heap for some reason starting to flatline after awhile. Unfortunately this is with 25~35 reduced CPU.

Uploading code at 12:21 restores the more variable heap behavior and CPU performance. It seems like IVM starts to do full GCs within every tick at some point..
@artch It could help if we could cleanly reset our IVM through code..
-
There's a current PR for it here https://github.com/screeps/driver/pull/30 by @The_General. if there were a cooldown on it, i feel like it could be a viable solution. would a 1-5k tick cooldown between calls work? im sure it would not be too difficult to prevent it from being called so frequently it negatively affects tick times and the back end...

-
I am seeing the same thing as descirbed by @TuN9aN0. After the heap limit was increased 6 days ago the heap stats started "flatlining" and cpu costs increased. Basically ive not had anything in my bucket since the increased limit.
The only code i have that reacts to the heap limits is my own garbage functions that runs at certain thresholds of the heap size, deleting certain cached objects once the limits are approached. I guess its possible that my caches are getting too big, i will attempt to clear them also after a certain global age has been reached in addition to the heap limits approached and see if this can help.
-
I also tried resetting my own caches to recover, no measurable effect, flatline persists..
-
Yeah - I "flatlined" for about 10 hours overnight. It cost me ~25 CPU/tick. This was CPU my code never saw: it was used either before the start or after the end of my tick.
Restarting the VM fixed it.
-
What i am observing is an increased general cost for all my functions when the heap is "flatlining". Calling my own gc functions had no effect, same as calling the offical gc(). Only a code upload resets the heap for me.
-
Could that be some gc death loop?
Where it tries to remove garbage that somehow links to it self until it decides to give up and wait for the next tick?
-
That brings me to an idea,
try to build up artificial garbage over some ticks and then delete it.
It would be interesting to see if that has any effect.