IVM heap usage & game objects
-
@artch I guess there's other things going into the equation (such as creeps/structures).
I think it would probably be sufficient until we get persistent game objects. My understanding was that the ETA was that was not too far away. I'm GCL 24 right now, so there's only 20% more CPU I can get.
-
Alright, we've temporarily increased heap limit by 64 MB. We'll keep an eye on our servers, to see if they actually can mantain such memory usage.

-
Just a individual feedback: For me 64MB is not enough to stand the ~100MB spikes. The time before the tweak my memory has magically stabilized, currently he doesn't. I don't have to call gc() myself anymore, to prevent out of memory IVM resets. But intick-autoGC triggers regularly and consumes a significant amount of cpu. Before I was at ~265cpu/tick in average, currently it's over 300.
-
@demawi Please elaborate what tweak are you referring to?
-
I meant the increase of the heap limit by 64MB (I have no knowledge about other changes today)
-
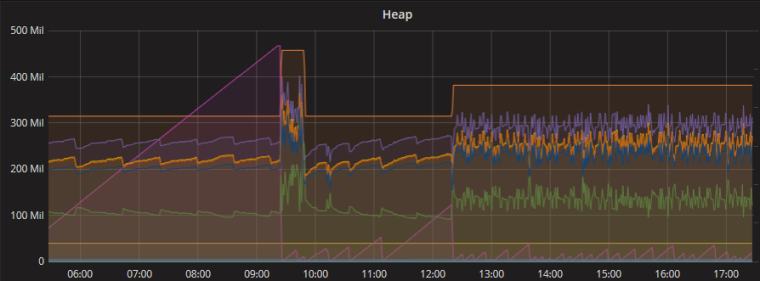
My heap is a lot more unstable after today. It reached thousands of ticks on the same global (purple line) before, but now its resetting a lot more often now.
-
@geir1983 said in IVM heap usage & game objects:
My heap is a lot more unstable after today. It reached thousands of ticks on the same global (purple line) before, but now its resetting a lot more often now.
I wonder what's going on there. The change was made at 12:30, right? I didn't see the 9:30 change on my plots, but I think you're on a different shard. It's the 9:30 change that seems to have messed something up for you.
-
This post is deleted!
-
Just wait a day or two, it should calibrate itself after some time and become more stable.
-
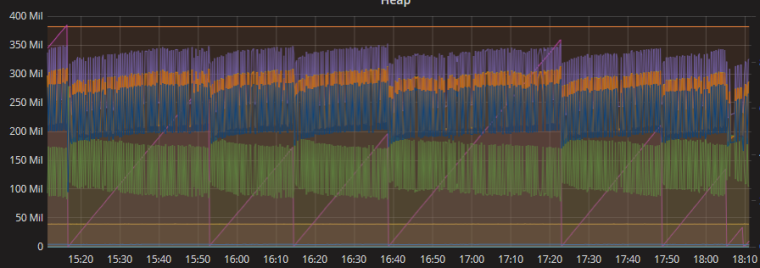
My heap is still very unstable since the change 5 days ago. My CPU not really taking a hit, as my global is not completely reset, but somehow the heap is not stable for me anymore. Before this change my heap was stable and could reach thousands (20k+) of ticks between global resets. Edit: Im now reaching around 500 ticks before my global is reset.
I do have vision in about 230 rooms, 30 owned room and about 1000 creeps if this is related.
-
@artch said in IVM heap usage & game objects:
Just wait a day or two, it should calibrate itself after some time and become more stable.
So my heap is getting worse and worse instead. Right now my globals last an average of 100 ticks, down from 20k+ when the size limit was increased. I am pretty sure i did not introduce any new caching etc on my end. This is now resulting in error messages and loss of ticks. I have attempted to disable my path caching without any noticable effect. My heap usage (total_heap_size + externally_allocated_size / heap_size_limit) jumps between 60%-90% every other tick.
[8:31:40 AM][shard1]Error: Isolate was disposed during execution due to memory limit at () at runUser (/opt/engine/dist/core/runtime/make.js:164:34) at _tickDomainCallback (internal/process/next_tick.js:228:7) [8:31:43 AM][shard1]Script execution has been terminated: your isolate disposed unexpectedly, restarting virtual machine
-
@geir1983 What happens if you remove your code and leave empty
main? You can try to do that on another shard/PTR, if heap is stable in this case, then the problem is in your code.
-
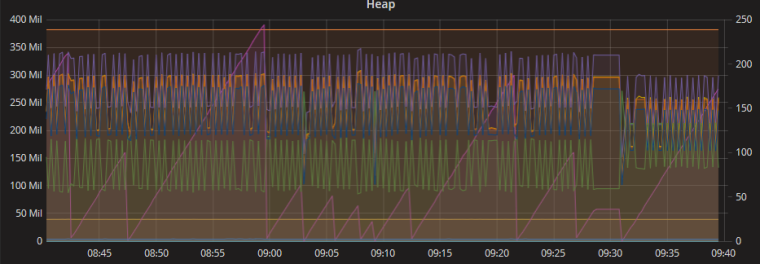
@artch o i left my code running with an empty main for 180 ticks on shard 1, the heap is still jumping a lot, but it has a lower base line, now jumps between 55%-80% with no code running at all. Now my Observers/creeps are also not running so there is also less rooms in vision.
The flat line at 09:30 was when i inserted a return as the first statement in my Main, without logging the heap stats.
-
@geir1983 Heap jumping is intended, it's how GC works. Do you have any errors with empty main?
-
I did not see any errors during my empty Main, but the errors were sporadic before. I left it for a while, but this short time already reduced my creep count from 1000 to 800, i did not want to continue running this test as the result were showing heap usage of up to 80% with no code running.
My issue is that the heap was perfectly stable before the heap limit was increased. I do get that we have to take care of the heap usage in code, but if it was fine before the limit was increased, why is it now hitting the ceiling once it should have even more room?
-
result were showing heap usage of up to 80% with no code running.
Again, it seems normal. Garbage collection may start running approximately at this point.
My issue is that the heap was perfectly stable before the heap limit was increased. I do get that we have to take care of the heap usage in code, but if it was fine before the limit was increased, why is it now hitting the ceiling once it should have even more room?
I think it's just a coincidence, raising heap limit itself shouldn't affect it this way, the real reason is elsewhere.
-
@artch said in IVM heap usage & game objects:
result were showing heap usage of up to 80% with no code running.
Again, it seems normal. Garbage collection may start running approximately at this point.
I still think that running garbage collection every second tick even when my code is not running seems excessive, especially when it was running thousands of ticks without triggering at all before the change that increased the total heap available. It might be random and a coincidence, but to me it seems like it was introduced at that change, as shown in my previous posts.
-
@geir1983 is it possible that the change gave GC enough heap that it skips every other tick now, where previously it ran every tick? Wouldn't this have kept heap to a minimum every tick previously, while now it bounces around?
-
@Gankdalf I have no idea, it sounds plausible, but my graphs were atleast not showing this. I attempted to run gc() every tick to see if this worked like you suggested, but it destroys my bucket, the call costs 70-90 cpu. Is there a different version that is running in the background?
-
@geir1983 Does the automatic GC call count against your bucket if it is triggered by the Game object creation each tick (which is likely the cause of a lot of this issue in the first place)?