Posts made by 6g3y
-
Regarding the issue of account theftposted in General Discussion
I want to ask, why is my friend banned, but he can still be spawned? My friend said he didn't do anything and his account has been banned for a long time But he can be used?
https://screeps.com/a/#!/history/shard2/E52S55?t=55528700
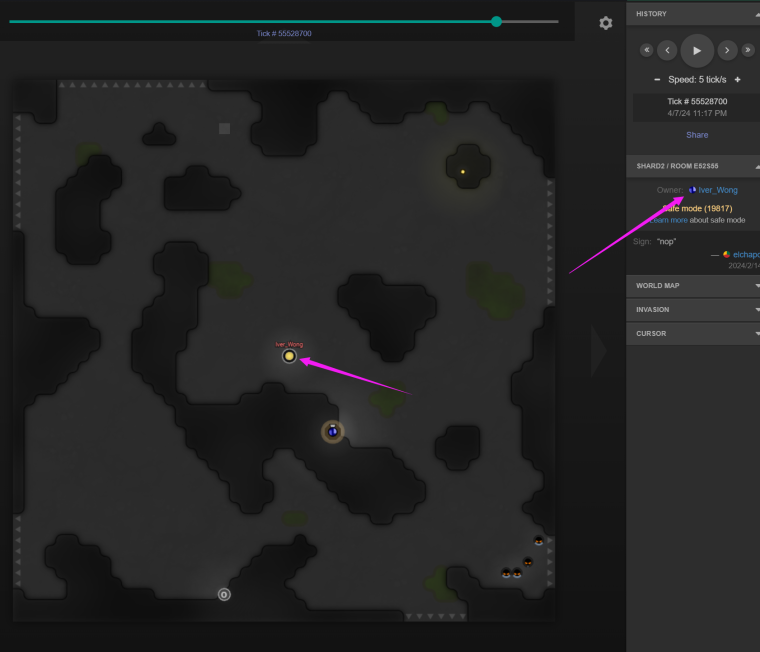
This is the specific information of the player's account
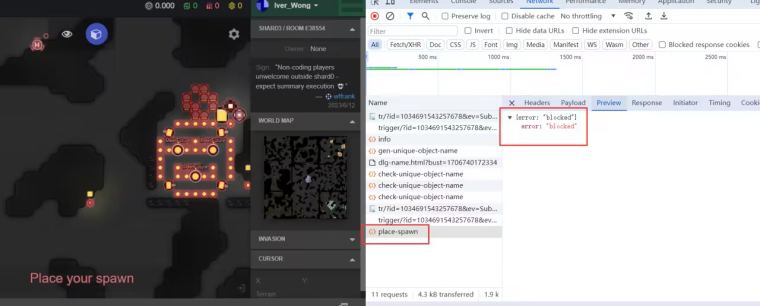
-
RE: Season #5 is open!posted in News & Announcements
@sirfrump It has been 3 years since the last update, and I asked the poster if they would update. I would like to know if there are any updates
-
RE: Season #5 is open!posted in News & Announcements
When will you update PowerCeep in the World game?

-
Does anyone know anything about the out of print skin?posted in General Discussion

This is all the skin I have. It is obviously in a linear distribution, and there are obvious faults below 39. Is there any announcement about these skin?
By the way, the probability of producing skin is about 1w pixel producing a purple skin and 25w producing a golden skin


-
There seems to be a bug in Game.cpu.getUsed()posted in General Discussion
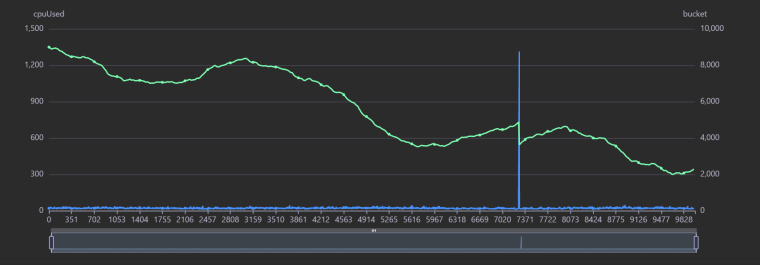
Game.cpu.tickLimit
Isn't the maximum value of 500?
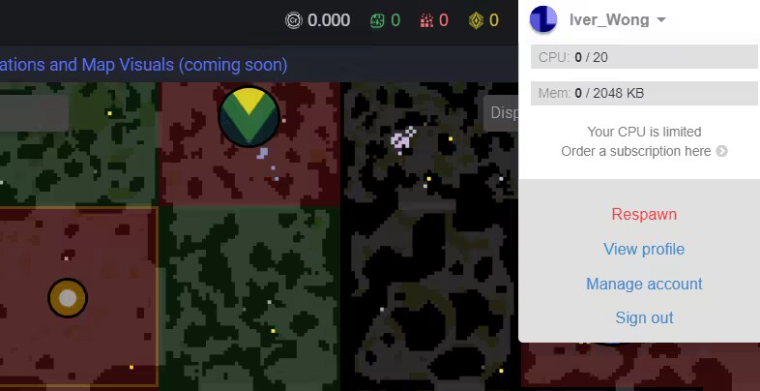
My bucket is reduced by more than 500 at a time, and it is not caused by the restart script
This is fatal to my bucket. Has anyone understood the reason?
-
RE: Visualization tool for Memoryposted in General Discussion
Run JSON.stringify(Memory)
And Copy all to HTML , Click Button
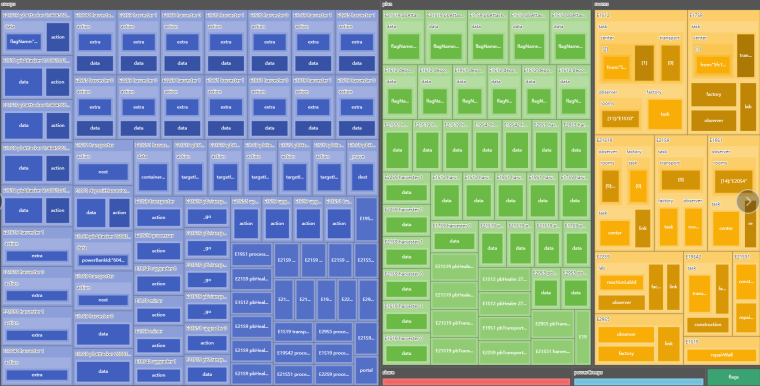
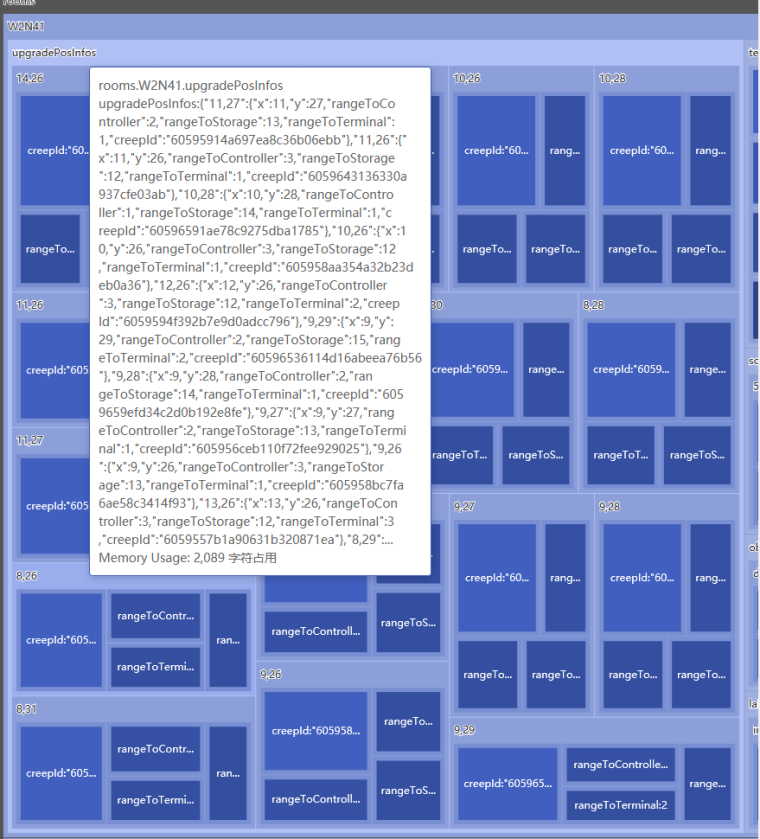
I think this tool can check for memory leaks. And analyze which memory can be placed in the global. This will be useful.
I hope I can share it with everyone, and hope everyone can make some suggestions
-
RE: Visualization tool for Memoryposted in General Discussion
<html style="height: 100%"> <head> <meta charset="utf-8"> </head> <body style="height: 100%; margin: 0"> Memory: <input type="text" name="fname" id="jsonStr" /> <button type="submit" id="btn">分析</button> 使用方法:控制台运行【JSON.stringify(Memory)】然后复制输出到这里点击分析就可以了 <div id="container" style="height: 100%"></div> <script type="text/javascript" src="https://cdn.jsdelivr.net/npm/echarts@5/dist/echarts.min.js"></script> <script type="text/javascript"> var dom = document.getElementById("container"); var myChart = echarts.init(dom); var app = {}; var option; let json = "{}" myChart.showLoading(); myChart.hideLoading(); let oriData = JSON.parse(json) console.log(oriData) let diskData = [] function getType(obj){ return "" + Object.prototype.toString.call(obj).replace("[object ","")+""; } function getChildrens(data,name,len){ let out = { name: name, value: len, datas:name+":"+data, children: [] } let da = JSON.parse(data); let obj = "[" + Object.prototype.toString.call(da).replace("[object ","")+""; //Object.prototype.toString.call(da) //out.name+=obj; if(typeof(da)=='object'){ for(let k in da){ //if(!da[k])continue; let subJson = JSON.stringify(da[k]); //console.log(k,typeof(subJson),da) let keyLen = obj != "[Array]"? (""+k).length : 0; // 如果是数组不用key keyLen += getType(k) == "Number"?0:2 // 不是数字要加双引号 let namet = obj == "[Array]"? "["+k+"]":k // 数组 [ 0 ] if(da[k]==undefined)out.children.push({name:namet,value:keyLen}) else out.children.push(getChildrens(subJson,namet,keyLen+(subJson?subJson.length:0))) } }else{ out.name+=":"+data } if(out.children.length==0) delete out.children; return out; } diskData = getChildrens(json,"Memoey",json.length).children //console.log(diskData) function colorMappingChange(value) { var levelOption = getLevelOption(value); chart.setOption({ series: [{ levels: levelOption }] }); } var formatUtil = echarts.format; function getLevelOption() { return [ { itemStyle: { borderColor: '#777', borderWidth: 0, gapWidth: 1 }, upperLabel: { show: false } }, { itemStyle: { borderColor: '#555', borderWidth: 5, gapWidth: 1 }, emphasis: { itemStyle: { borderColor: '#ddd' } } }, { colorSaturation: [0.35, 0.5], itemStyle: { borderWidth: 5, gapWidth: 1, borderColorSaturation: 0.7 } } ].concat(([...Array(12).keys()]).map(e=>{ return { colorSaturation: [0.35, 0.5], itemStyle: { borderWidth: 5, gapWidth: 1, borderColorSaturation: 0.75-e*0.05 } } })); } console.log(getLevelOption()) function transform(datas){ if(datas.length>2500/2){ datas=datas.substr(0,2500/2-4)+"..." } out = "" for(let i = 0;i<datas.length;i+=50){ out+='<div class="tooltip-title">' + datas.substr(i,50) + '</div>' } return out; } function update(json){ diskData = getChildrens(""+json,"Memoey",json.length).children myChart.setOption(option = { tooltip: { formatter: function (info) { var value = info.value; var datas = info.data.datas; var treePathInfo = info.treePathInfo; var treePath = []; //if(datas.length>50)datas=datas.substr(0,50)+"..." datas=transform(datas) for (var i = 1; i < treePathInfo.length; i++) { treePath.push(treePathInfo[i].name); } return [ '<div class="tooltip-title">' + (formatUtil.encodeHTML(treePath.join('.')).replace(".[","[").replace(".[","[").replace(".[","[").replace(".[","[")) + '</div>', '<div class="tooltip-title">' + datas + '</div>', 'Memory Usage: ' + formatUtil.addCommas(value) + ' 字符占用', ].join(''); } }, // visualMap: [{ //type: 'continuous',//连续型 //dimension: 2,//对应的数组维度 //show: false,//颜色范围选择的小工具不显示 //color: ['#1710c0', '#0b9df0', '#00fea8', '#00ff0d', '#f5f811', '#f09a09', '#fe0300'].reverse(),//颜色过渡,可自选 //}], series: [ { name: 'Memory', type: 'treemap', visibleMin: 5000, label: { show: true, formatter: '{b}' }, upperLabel: { show: true, height: 30, }, itemStyle: { borderColor: '#fff' }, levels: getLevelOption(), data: diskData } ] }); if (option && typeof option === 'object') { myChart.setOption(option); } } //update(json); document.getElementById('btn').addEventListener('click', function(){ try{ update(document.getElementById('jsonStr').value) }catch(e){ //alert("代码错误,如果不是JSON问题,请联系6g3y") console.log(e) } try{ update(document.getElementById('jsonStr').value) }catch(e){ alert("代码错误,如果不是JSON问题,请联系6g3y") console.log(e) console.log(document.getElementById('jsonStr').value) } }); </script> </body> </html> -
Visualization tool for Memoryposted in General Discussion
I write a Memory analyzer. Based on Echarts, Memory visualization tool
