6g3y
@6g3y
13
Posts
2364
Profile views
0
Followers
7
Following
Posts made by 6g3y
-
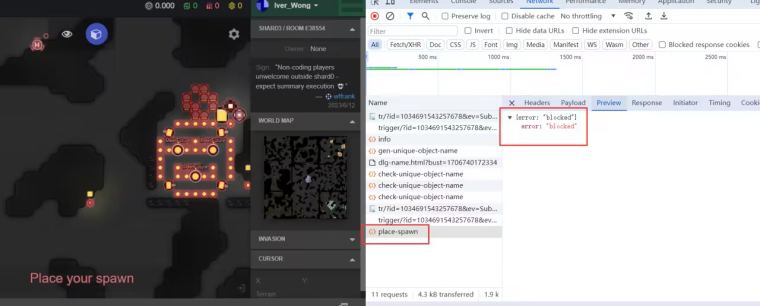
Regarding the issue of account theftposted in General Discussion
I want to ask, why is my friend banned, but he can still be spawned? My friend said he didn't do anything and his account has been banned for a long time But he can be used?
https://screeps.com/a/#!/history/shard2/E52S55?t=55528700
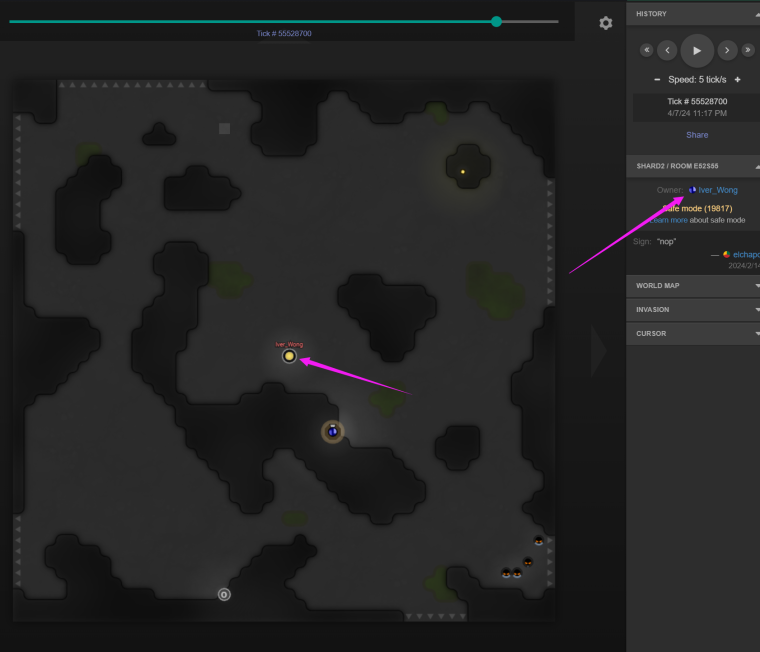
This is the specific information of the player's account
-
RE: Season #5 is open!posted in News & Announcements
@sirfrump It has been 3 years since the last update, and I asked the poster if they would update. I would like to know if there are any updates
-
RE: Season #5 is open!posted in News & Announcements
When will you update PowerCeep in the World game?

-
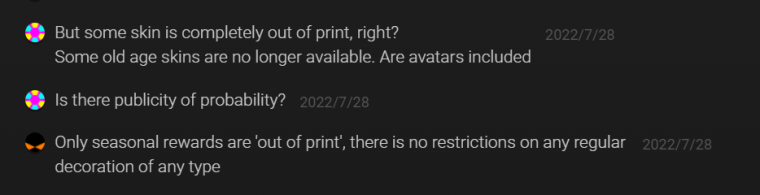
Does anyone know anything about the out of print skin?posted in General Discussion
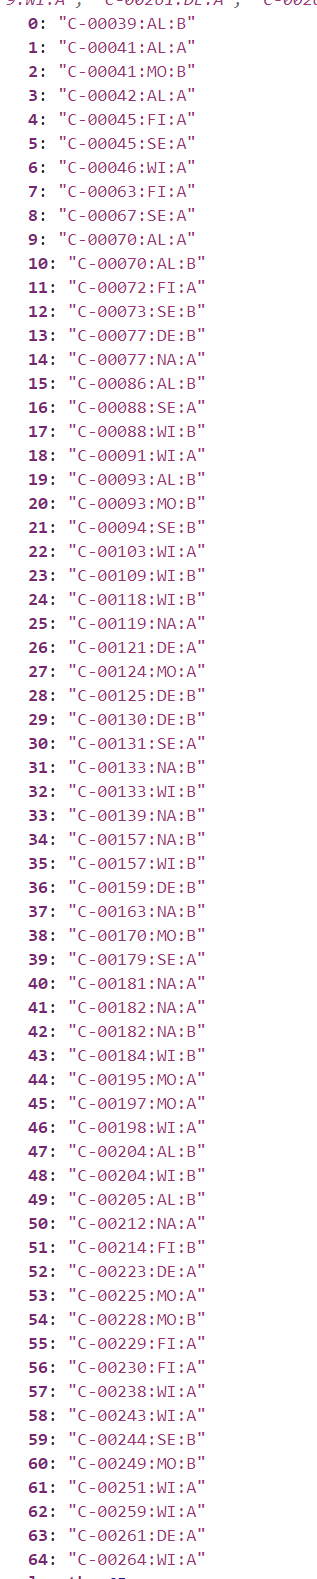
This is all the skin I have. It is obviously in a linear distribution, and there are obvious faults below 39. Is there any announcement about these skin?
By the way, the probability of producing skin is about 1w pixel producing a purple skin and 25w producing a golden skin


-
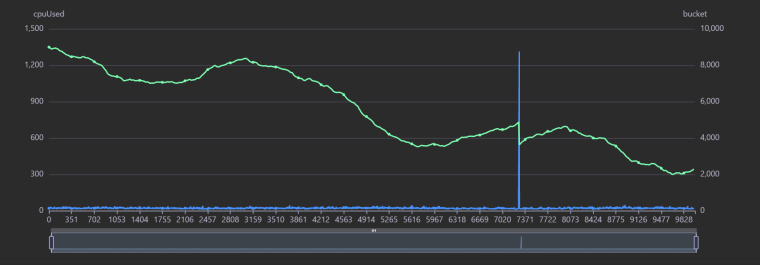
There seems to be a bug in Game.cpu.getUsed()posted in General Discussion
Game.cpu.tickLimit
Isn't the maximum value of 500?
My bucket is reduced by more than 500 at a time, and it is not caused by the restart script
This is fatal to my bucket. Has anyone understood the reason?